Ohmic Food Heating: How Current Generates Heat Within
2026-11-10
Ohmic Food Heating: How Current Generates Heat Within
Ohmic Food Heating produces heat inside a conductive food when electrodes drive electric current through it. The food is part of the electrical path, and its resistance converts electrical energy to heat throughout regions carrying current. A Sheffield Hallam University study models that distributed heat source, while a tomato experiment illustrates why the electrical properties of the food can change as it warms.
The food completes the path between the electrodes
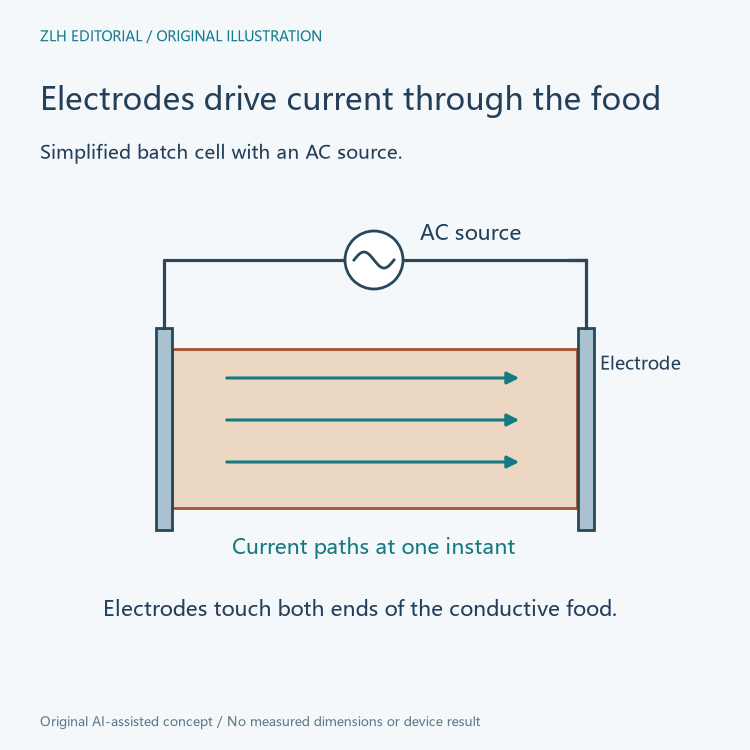
In a simple batch cell, a conductive sample lies between two electrodes. An applied voltage establishes an electric field in the sample. Charge can move through conductive regions of the food, including water-based regions containing dissolved ions. The electrodes make contact with the sample at its boundaries. The electrical work that drives current is dissipated through the material that carries it.
This arrangement is different from a heated jacket around a vessel. In a jacketed vessel, heat begins outside the food and travels inward. The ohmic cell puts an electrical heat source within the food volume. Heat still moves from warmer regions to cooler regions, and some energy can leave through the surroundings. Those transfers occur in addition to the distributed generation.
Electric field and conductivity determine local generation
In a simple conductive model, the local power converted to heat per volume is current density multiplied by electric field along the current direction. When current density is proportional to the local field, the power density is electrical conductivity times the square of the field magnitude. At the same local field, a more conductive region generates more heat per volume in that model.
The field is a local quantity. A voltage displayed at the supply describes the difference across electrodes, while the field inside the food depends on geometry and how conductivity is distributed. Dividing the voltage by the spacing is a useful simplification for a uniform region between parallel electrodes away from edge effects. Shapes and mixtures can depart from that approximation.
A two-region model shows why field conditions matter
Imagine two parallel strips of equal length connecting the same pair of electrodes, each with a different conductivity. In the idealized geometry, both experience the same field along their length. The strip with twice the conductivity then generates twice the heat per volume. This example holds field and geometry fixed to isolate the role of conductivity.
If the two regions instead lie one after the other in a single uniform cross section, they carry the same current density in a steady one-dimensional model. The less conductive region needs a greater local field to carry that current. The comparison illustrates why conductivity alone does not identify which region generates the most heat in a real mixture. The position of each region affects the current paths.
For the series example, dividing the common current density by each region's conductivity gives its local field. Multiplying that field by the same current density gives power density. The result is larger in the region with lower conductivity under those assumptions. A comparison therefore needs to identify which quantity is shared.

Conductivity can change while the sample warms
Darvishi and colleagues report that the conductivity of their prepared tomato samples generally rose as temperature increased through much of the measured range. They also describe a departure when bubbling occurred. Their observation concerns that material and their laboratory cell. It illustrates why a single room-temperature conductivity may leave out information needed to explain how a process develops.
Temperature is also different from power density. The same deposited energy per volume can produce different temperature changes in materials with different heat capacities. The Sheffield Hallam model treats heat generation, heat transfer and temperature-dependent properties together. A flowing product adds the effect of how long different portions spend in the active region.
Read the electrical path alongside the temperature record
A useful equipment diagram can identify the electrodes, the sample volume in the field and the places where temperature is measured. The electrical measurements describe energy supplied to the cell, while temperature measurements describe how the material responds at specific locations and times. Keeping both makes a heating curve easier to interpret.
For a product containing several components, the location and thermal properties of the measured region matter as well. A bulk temperature and a local heat generation rate describe different aspects of the process. Linking the two requires the food properties and geometry used in the model or experiment.
Primary references are the Sheffield Hallam batch ohmic heating study and the tomato conductivity experiment by Darvishi and colleagues. See food equipment references and technical articles.