
Starch Gelatinization and Pasting Measure Different Changes
2026-11-09
Starch Gelatinization and Pasting Measure Different Changes
A starch test report can show an onset temperature on one page and a pasting temperature on another. Both can come from the same sample of rice starch. Starch gelatinization and pasting are related changes during heating in water, but the instruments observe different signals. A differential scanning calorimeter measures heat flow. A viscosity test follows the resistance of a moving starch dispersion through a defined heating and cooling history. The two plots can be read together once each marker is assigned to its own measurement.
Heat flow can reveal a transition in the granules
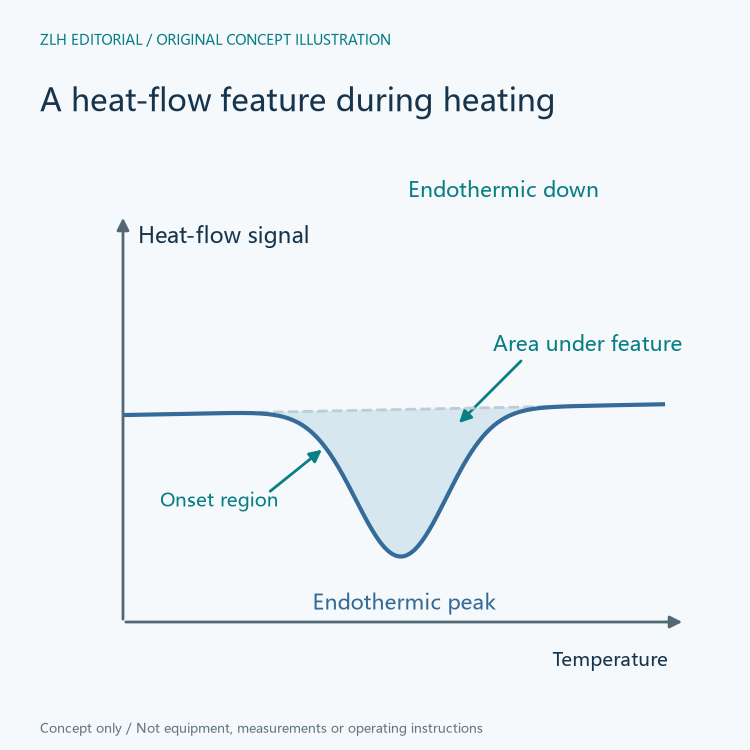
Starch granules have an internal organization that changes when the granules are heated with water. They can swell and lose some of their original structural order. A differential scanning calorimeter, commonly abbreviated DSC, records a heat-flow signal relative to a reference as temperature changes. In a hydrated starch sample, an endothermic feature can be associated with gelatinization. Its onset is a characteristic temperature derived from the beginning of the feature, and its peak identifies the position of maximum deflection from the baseline for that feature. The area of the baseline-corrected feature provides a basis for an enthalpy result.
Those quantities carry different units and answer different questions. A temperature in degrees identifies a point on the thermogram. An enthalpy per gram summarizes energy over the transition as measured by the chosen method. Neither describes how much effort a paddle needed to stir the material. Shimadzu's application note compares hydrated samples of wheat, corn and sweet potato starch, and its comparisons with salt water show why the composition of the test mixture belongs next to the thermal result.
A pasting curve follows the changing response to motion
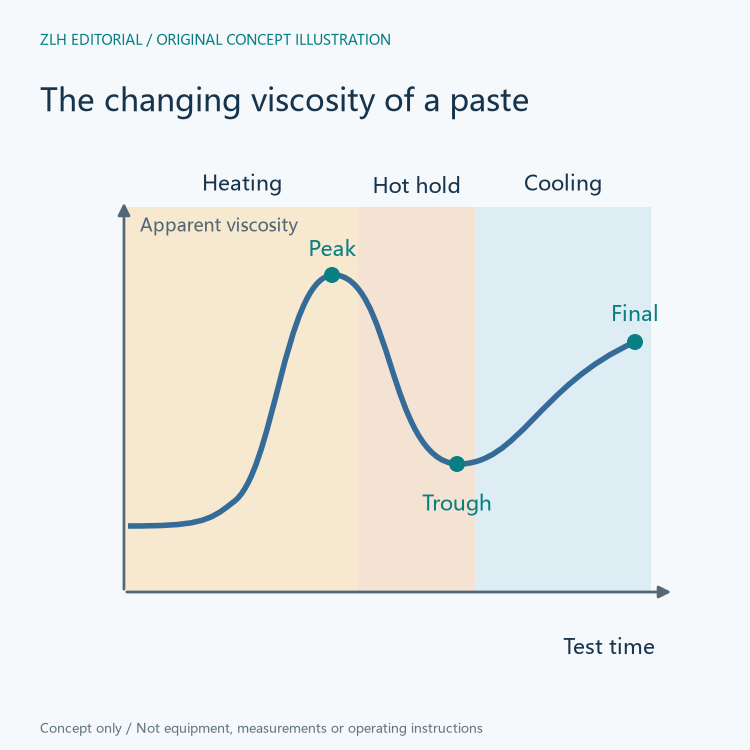
A Rapid Visco Analyzer, or RVA, tracks an apparent viscosity response while a paddle moves through a dispersion under controlled test conditions. The result is a curve along the test sequence. In a typical profile the signal starts low, rises during heating as swelling contributes to resistance, and can reach a peak. Continued heating and mixing can weaken the paste structure and bring the apparent viscosity down toward a hot trough. Cooling can increase the measured resistance again as starch molecules reorganize. The exact curve belongs to the starch and the test program.
NETZSCH illustrates an RVA-style curve measured with its rotational rheometer and a starch paddle. The note distinguishes the viscosity peak, the hot trough and the final viscosity after cooling. It also identifies breakdown as the difference between the peak and trough. This is a comparison between two points on one viscosity curve. The final minus the trough is a separate comparison often called setback. A peak temperature on a calorimeter plot does not enter either subtraction.
One rice variety illustrates the difference in markers
Wickramasinghe and Noda studied starch isolated from nineteen Sri Lankan rice varieties. They reported thermal results from DSC and pasting results from an RVA in separate tables. For the AT 405 sample, the DSC table reports an onset gelatinization temperature of 64.1 degrees Celsius and a peak gelatinization temperature of 69.4 degrees Celsius. The pasting table reports a pasting temperature of 73.5 degrees Celsius and a peak viscosity of 458 Rapid Visco Units (RVU). The temperature labels and the viscosity label describe different events in different tests.
The ordering in that example should not become an assumed numerical offset for every starch. The authors found differences among the varieties, and their comparisons retained the identity of each sample and test. An observation that a mixture has begun to absorb heat in a calorimeter can be paired with a later rise in viscosity in a separate protocol. The temperature where viscosity first rises measurably is an instrument and method observation. It is not obtained by relabeling the onset of the calorimetric endotherm.
Report the thermal and flow histories alongside the results
When comparing starch lots or formulations, it helps to retain which material was tested, whether the report concerns isolated starch or a mixture, and the water and additive context. The temperature ramp and holding stage matter to interpretation of the viscosity trace because the sample is changing as it is measured. Stirring adds another condition. For the thermal trace, the heating program, sample preparation and onset or peak convention identify the reported event.
In a kitchen equipment context, the measurements can explain why two mixtures heat through similar ranges yet thicken differently under agitation. An instrument curve can describe the material's response during a controlled comparison. A larger vessel has its own heating distribution and mixing conditions, so the temperature and viscosity markers should stay attached to the test that produced them.
Related material appears in the equipment reference and technical article directory.
Primary sources. Wickramasinghe and Noda's original rice starch study, methods and Tables 1 and 2. Shimadzu original DSC application measurements for hydrated starch. NETZSCH original starch pasting rheometry application note.